TCP latency and loss
Overview
Reading this blog made me very curious: Path Quality Part 1: The Surprising Impact of 1% Packet Loss
The final result is:
In this study, 1% of packet loss caused a 70.7% decrease in throughput.
When applications experience performance problems usually someone blames the network.
It is not always easy to convince that latency and packet loss significantly affect TCP performance, and speed of light is not negotiable.
Therefore, I thought I would replicate the scenario and do some measurement tests to dig deeper on the topic.
Let me be clear, although I usually "plan my work, work my plan" but for this lab I simply improvised, writing scripts on the go, just to make an MVP.
There is much to improve to automate the lab and improve the reliability of the results. I don't claim that the results are reliable, they can vary a lot with different hardware and software, and even the measuring instruments are probably not very reliable.
That said, in this blog I report the tools I used to do the tests and the results I got.
Topology
I started the lab with a simple topology. I run it on an Intel NUC i3, the same box that runs my home network services.
So I created three containers in a simple topology:
Docker-compose
The docker-compose.yaml file to create the lab.
The containers names are:
- first (iperf client)
- second (the router)
- third (iperf server)
Some static routes are necessary to fix the routing.
 1services:
 2  first:
 3    image: ubuntu:latest
 4    #image: public.ecr.aws/lts/ubuntu:edge
 5    container_name: first
 6    tty: true
 7    networks:
 8      - first
 9      - first-to-second
10    cap_add:
11      - NET_ADMIN
12  second:
13    image: ubuntu:latest
14    #image: public.ecr.aws/lts/ubuntu:edge
15    container_name: second
16    tty: true
17    networks:
18      - first
19      - first-to-second
20      - second-to-third
21    cap_add:
22      - NET_ADMIN
23  third:
24    container_name: third
25    image: ubuntu:latest
26    #image: public.ecr.aws/lts/ubuntu:edge
27    tty: true
28    networks:
29      - first
30      - second-to-third
31    cap_add:
32      - NET_ADMIN
33
34networks:
35   first:
36     driver: bridge
37   first-to-second:
38     name:  first-to-second
39   second-to-third:
40     name: second-to-third
Let's start the containers:
1docker-compose up -d
2Starting first  ... done
3Starting second ... done
4Starting third  ... done
We need to add some static routes to have first reach third.
Network and next-hop addresses may change in your environment.
First container:
1# first
2docker exec -it first bash
3apt update && apt install -y iputils-ping iperf3 iproute2
4ip route add 192.168.224.0/24 via 192.168.192.3
5ping 192.168.224.2
Third container:
1# third
2docker exec -it third bash
3apt update && apt install -y iputils-ping iperf3 iproute2
4ip route add 192.168.192.0/24 via 192.168.224.3
5ping 192.168.192.2
6iperf3 -s
Then back to first to execute iperf3 client to confirm it works:
1# first
2docker exec -it first bash
3iperf3 -c 192.168.224.2
This result is the baseline, the throughput when containers are directly routed, no shaping/policing/packet loss in between.
1[ ID] Interval           Transfer     Bitrate
2[  5]   0.00-10.05  sec  17.0 GBytes  14.6 Gbits/sec                  receiver
I prefer to baseline to 1G, so let me set tc to shape to 1G on second:
1# second
2docker exec -it second bash
3tc qdisc add dev eth1 root tbf rate 1gbit latency 1ms burst 1mbit
4tc qdisc show  dev eth1
Running iPerf again on first, this is the result:
1[ ID] Interval           Transfer     Bitrate         Retr
2[  5]   0.00-10.00  sec  1.11 GBytes   957 Mbits/sec  2363             sender
3[  5]   0.00-10.04  sec  1.11 GBytes   952 Mbits/sec                  receiver
Good, the throughtput is around 950Mbps.
The script
After creating the containers and setting a performance baseline let's create a script to automate the test.
The script, executed on first, executes iperf3 multiple times, right after using tc to change the loss and latency values on eth0.
I chose some arbitrary latency and loss values.
The output will be logged to out.log.
This is the script:
 1latency="1 2 3 4 5 10 20 30 40 50 60 80 90 100"
 2loss="0 1 2 3 4 5 6 7 8 9 10 15 20 25 30 35 40 45 50"
 3# remove tc config con eth0 if any
 4tc qdisc del dev eth0 root netem
 5touch out.log
 6for lo in $loss
 7do
 8  for la in $latency
 9  do
10    echo "LATENCY $la   LOSS $lo"
11    if [ "$lo" -ne 0 ]; then
12      tc qdisc add dev eth0 root netem loss "$lo"% delay "$la"ms
13    else
14      tc qdisc add dev eth0 root netem delay "$la"ms
15    fi
16    iperf3 -f m -c 192.168.224.2 -T "$lo $la" >> out.log
17    sleep 2
18    tc qdisc del dev eth0 root netem
19  done
20done
21echo "LATENCY,LOSS,VALUE,UNIT,DROPS" > out1.log
22grep sender out.log | awk '{print $1","$2","$9","$10","$11}' | sed "s/://g" >> out1.log
Let's run the script on first:
1# first
2docker exec -it first bash
3./test.sh
Ignore the error, t happens because we remove a tc config on eth0 when no config is applied yet.
1Error: Invalid qdisc name.
The script output
The output looks like this:
 1cat out1.log
 2
 30,1,956,Mbits/sec,1391
 40,2,954,Mbits/sec,1024
 50,3,907,Mbits/sec,1388
 60,4,833,Mbits/sec,1065
 70,5,864,Mbits/sec,1123
 80,10,437,Mbits/sec,680
 90,20,400,Mbits/sec,585
100,30,200,Mbits/sec,352
110,40,250,Mbits/sec,346
120,50,185,Mbits/sec,412
130,60,103,Mbits/sec,403
140,80,78.2,Mbits/sec,490
150,90,80.9,Mbits/sec,392
160,100,83.9,Mbits/sec,421
Where the colums are, in order:
- packet loss configured in tc
- latency configured in tc
- measured iPerf bandwidth
- unit
- number of lost packets
Create a spreadsheet
After fixing the unit, another script creates and Excel file with a pivot table.
Install required Python libraries:
1python -m pip install pandas openpyxl
Then run the script.
Input:
- out1.log
Output:
- output_file.xlsx
1import pandas as pd
2# Read the CSV file into a Pandas DataFrame
3df = pd.read_csv('out1.log')
4# LOSS,LATENCY,VALUE,UDM,DROPS
5matrix = df.pivot_table(index='LOSS', columns='LATENCY', values='VALUE', aggfunc='first')
6# Write the matrix to an Excel file
7matrix.to_excel('output_file.xlsx')
The final result is a output_file.xlsx.
The results
I open output_file.xlsx and created a few graphs to visualize the result.
With zero packet loss introduced by tc, we see how increasing the latency the troughput goes down:
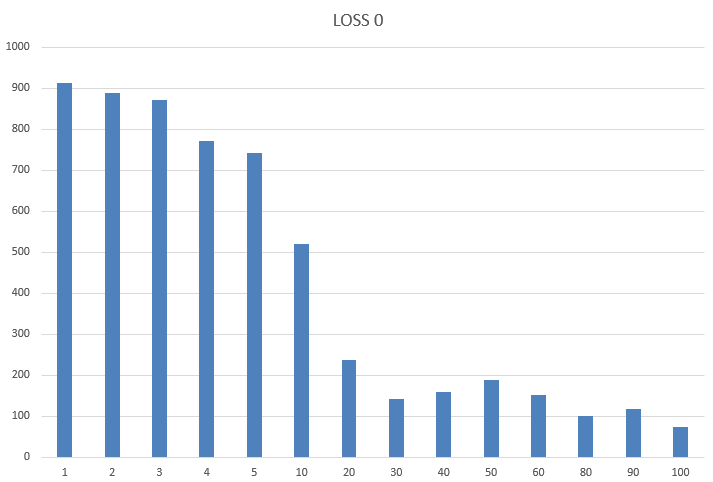
If we translate the values in percent, where the first is 100%, we see a big jump when latency goes from 5ms to 10ms:
| LATENCY | BW | PERCENT |
|---|---|---|
| 1 | 912 | 100.00% |
| 2 | 888 | 97.37% |
| 3 | 872 | 95.61% |
| 4 | 772 | 84.65% |
| 5 | 742.4 | 81.40% |
| 10 | 520 | 57.02% |
| 20 | 237.6 | 26.05% |
| 30 | 140.8 | 15.44% |
| 40 | 160 | 17.54% |
| 50 | 188 | 20.61% |
| 60 | 150.4 | 16.49% |
| 80 | 100 | 10.96% |
| 90 | 116.8 | 12.81% |
| 100 | 72.96 | 8.00% |
Introducing just 1% of packet loss with tc we notice a significant decrease in the initial thoughput, from 912 Mpbs to 608 Mpbs, and also a faster decrease as latency grows:
| LATENCY | BW | PERCENT |
|---|---|---|
| 1 | 608 | 100% |
| 2 | 247.2 | 41% |
| 3 | 132.8 | 22% |
| 4 | 102.4 | 17% |
| 5 | 59.52 | 10% |
| 10 | 37.28 | 6% |
| 20 | 9.68 | 2% |
| 30 | 14.08 | 2% |
| 40 | 19.2 | 3% |
| 50 | 8.96 | 1% |
| 60 | 3.28 | 1% |
| 80 | 3.44 | 1% |
| 90 | 1.92 | 0% |
| 100 | 5.36 | 1% |
Final considerations
My small test is far from being reliable and significant. To corectly evaluate the impact of loss and latency a much better lab with proper tools should be used.